
The Key Metrics Column
This article covers the Key Metrics column introduced in version 26.2.
Available in version: 26.2 and up.
Applicable to: any license that includes the Key Metrics column. If yours does not, the column and its settings are not present at all.
Required hardware: none to show the column. Individual metrics need their own source: force, pressure and torque metrics need plates, launch monitor metrics need a launch monitor, and the golf timing metrics need only the swing markers, so they also work on camera-only recordings.
Which version of the software am I using?
What is the Key Metrics column?
The software measures far more than it can show at once. Force, pressure, timing, torque and launch monitor numbers all exist for every swing you record, but most of them live inside a graph or a data box you have to go looking for.
The Key Metrics column lets you pick the five or six numbers you want in front of you the whole time. You choose them once. They sit in a vertical column between the video and the data boxes, and they update as you move between swings and students.
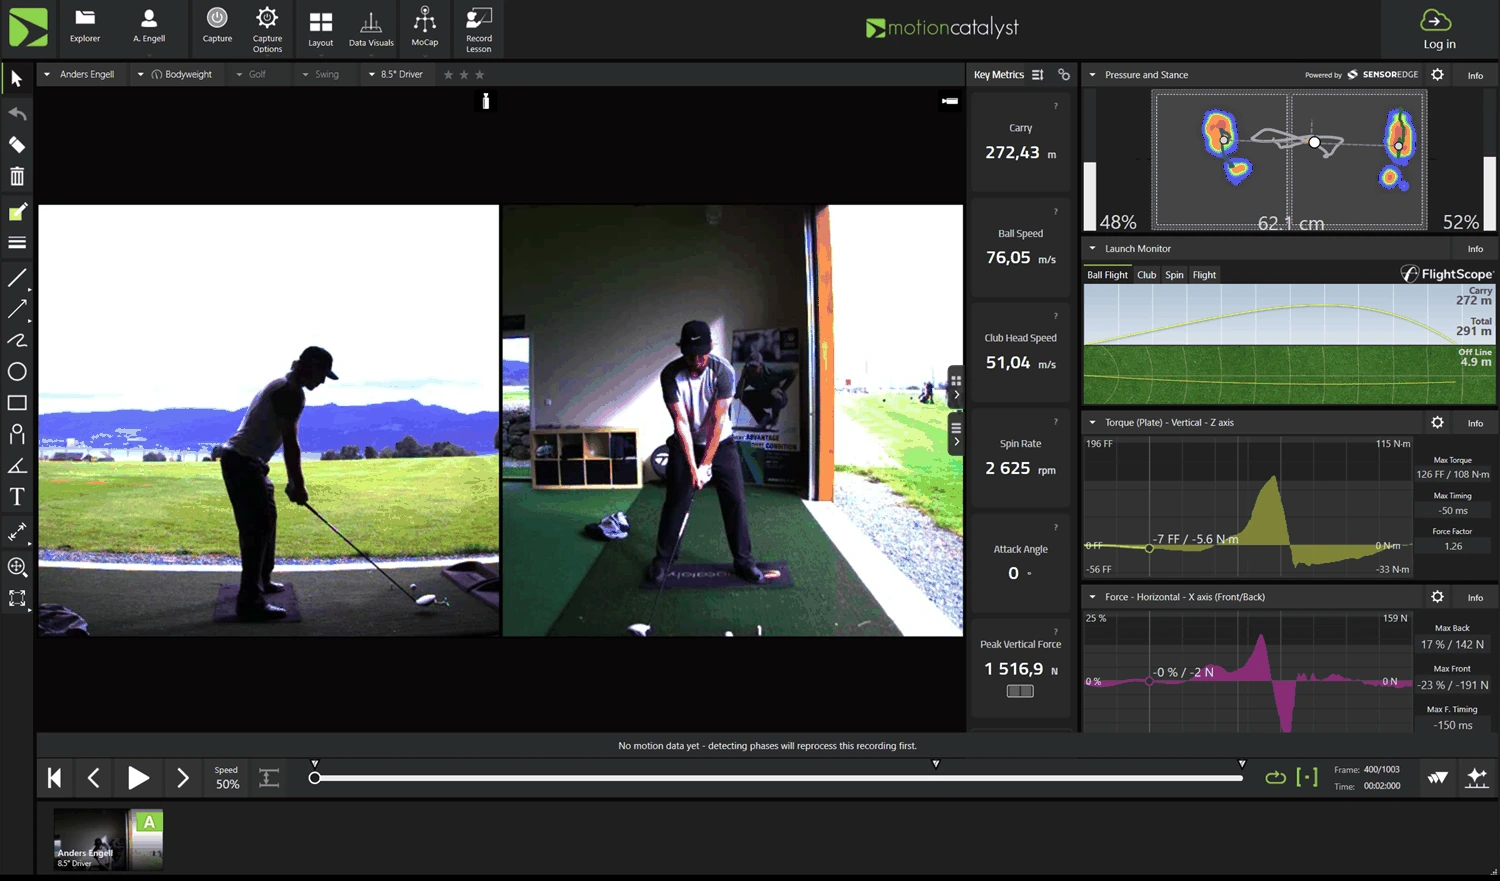
The column is separate from the Key Metrics data box , which shows activity metrics and exports them to a TSV file.
Nothing you do in the column changes the swing, the video or the graphs. It only changes which numbers you are looking at.
The screenshots in this article come from a recorded driver swing with pressure plates, force plates and a launch monitor, so the values are that swing’s real measurements. Numbers follow your own settings: units follow the measurement unit setting, so an imperial install shows yards where these show meters, and the decimal separator follows your regional settings.
Showing and hiding the column
The column is switched on per view mode, and it remembers each mode separately. Most coaches want the numbers while working a single swing and want the screen clear when two swings are side by side, or the other way round. Set it once per mode and it stays that way.
The control is a checkbox at the bottom of the Layout menu, below the list of view modes. It reads Show Key Metrics in followed by the view mode, for example Show Key Metrics in Single Recording. It applies to the view mode you are looking at when you change it.
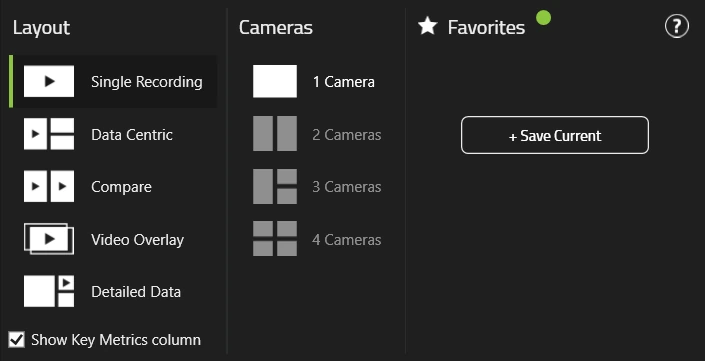
There is also a small chevron at the edge of the column that hides it. If the column disappears after you click something there, the Layout menu checkbox is how you bring it back.
| View mode | Is the column available? |
|---|---|
| Single Recording | Yes |
| Data Centric | Yes |
| Detailed Data | Yes |
| Compare | Yes, as a horizontal strip rather than a vertical column |
| Video Overlay | No. The screen is given entirely to the two superimposed videos. |
If the column does not appear in any view mode, and there is no Show Key Metrics in checkbox in the Layout menu either, your license does not include this feature. Contact us and we will tell you what your seat covers.
Reading a card
Each card carries three things: the name of the metric, its current value, and its unit. Cards are stacked in the order you chose, top to bottom.

You can drag a card up or down in the column to reorder it without opening any dialog.
Clicking a card opens a short menu for that card alone: change the metric, remove it from the column, or open its description.
The question mark
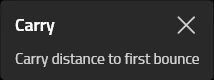
Cards for metrics that have a written description carry a question mark in the top right corner. It opens a short, plain-language explanation of what the metric measures and how to read it. This is the part to point a student at when they ask what a number means. Where we have enough tour data for that metric, the explanation also shows a tour average range.
When a number is missing
Three different things can happen, and they mean different things.
Most often the card stays in place and reads No data. That happens when the number could not be worked out. Usually the metric is anchored to a point in the swing that was not detected, so there is no instant to read a value at. Pressure metrics on a recording made without plates behave this way too: the card stays and reads No data.
A card can also show a dimmed –. That means one of two things. Either the value is still being calculated, or the column is set to normalized values and the student has no body weight on file. The tooltip on the card says which.
Launch monitor, force and torque metrics behave differently again. If the recording never had that hardware, the card stays in place and reads No data in this recording. A swing recorded without a launch monitor shows its Carry card with that message. The metric stays in your selection, and the card shows a value again on a recording that has the hardware.
Choosing which metrics you see
There are two ways in, and they suit different moments.
Add a single metric
Add metric… at the bottom of the column opens a list of metrics grouped by what the number comes from. On the recording below the groups are Center of Pressure, Force, Launch Monitor, Timing and Torque; other recordings and other activities show different groups. Pick one and it is appended to the column. This is the one to use mid-session when a student asks about something specific.
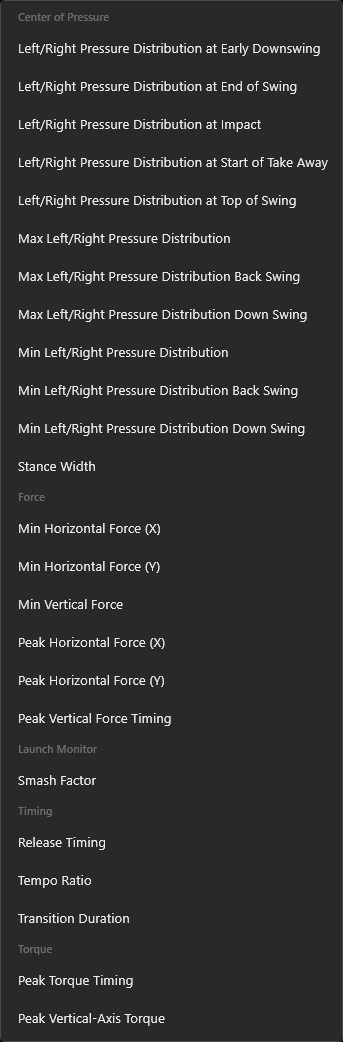
The list only offers metrics that are not already in the column, which is why Launch Monitor is short here: Carry, Ball Speed, Club Head Speed and Spin Rate are on cards already. Metrics the recording has no data for are still listed, marked Unavailable for this take. Turn off Show unavailable metrics to hide them.
Rebuild the whole column
Choose metrics… in the gear menu opens the full picker. There you can search by name, tick and untick metrics, and drag the selected list into the order you want. The top item in the list becomes the top card.
Changes apply to the column as you make them, so you can watch it take shape rather than committing blind. There is no cancel for the same reason, so treat Reset to defaults as what it is: a return to this activity’s original set, not an undo of your last move.
Past eight cards the column gets crowded and you lose the at-a-glance quality that makes it useful. From the ninth, the metric count in the Choose metrics window turns amber to say so. Nothing stops you from adding more, and nothing warns you at all if you pass eight using Add metric… instead. If you want more numbers than that, the graph panels serve them better, because they are built for depth rather than for glancing.
Metric sets
A metric set is a named group of cards you can load in one click. The software ships ten, grouped by activity, each built around a coaching question rather than around a piece of hardware. A golf swing has five; putting, baseball and softball batting and pitching have their own, so the list you see depends on the activity you are working in.
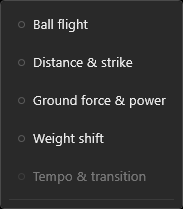
Your own saved sets appear below the ones that ship.
A set is dimmed when it cannot fill its cards on the open recording. That happens when the recording has no data from the hardware the set relies on, or when the set needs the detected swing points and the recording does not have them. Tempo & transition is dimmed above for the second reason: that recording has plates and a launch monitor, but its swing markers have not been detected yet. A dimmed set is still clickable. Its tooltip always reads “This take has no data from the hardware this metric set uses.”, even when the cause is missing swing markers.
The five sets for a golf swing
Ball flight: where the ball went and why.
Distance & strike: speed, contact quality and the numbers that turn into yardage.
Ground force & power: what the student is doing against the ground.
Weight shift: how pressure moves between the feet through the swing.
Tempo & transition: timing and rhythm through the top of the swing.
Saving your own
Build the column the way you want it, then use Save current as… and give it a name. It joins the list below the sets that ship. It also belongs to the activity you saved it under, so a golf set does not clutter the list when you are working with a baseball hitter.
You can save ten sets per activity. The software tells you the count when you reach the limit. Use Delete metric set on one you no longer need to make room.
Raw values or normalized to body weight
Two students can produce the same force number without producing the same performance. This setting is why. Under Value in the gear menu you choose between:
Raw values. Each metric in its own measured unit, converted to the unit system the software is set to.
Normalized to body weight. The same measurement expressed against that student’s own body weight. Force reads as a percentage of body weight, and torque reads as torque per kilogram of body mass, shown in N·m/kg.
A 900 N peak from a 60 kg junior and a 900 N peak from a 100 kg adult are the same raw number. Normalized, the junior’s peak reads about 153 % of body weight and the adult’s about 92 %. Use normalized values to compare one student with another, or the same student at a different body weight. Use raw values when you care about the actual load going through the ground, or when you are checking the hardware.
The setting only changes metrics that support body-weight normalization, which in practice means the force and torque ones. Ball flight numbers such as Carry and Ball Speed read the same either way, so some cards will not change.
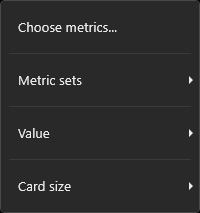
The gear menu holds four items: Choose metrics…, Metric sets, Value and Card size. The other controls sit where you use them: Add metric… at the foot of the column, the question mark on each card, and the metric sets button in the column header.
Normalized values need a body weight to divide by. If the student’s body weight is not set, the normalized option is grayed out and says why: “Set this student’s body weight to normalize these metrics.” Enter the weight on the student’s profile and the option becomes available. It is worth doing when you set up a new student, so normalized values are there the first time you want to compare that student with another. See New body weight measurement functionality .
Card size
Card size in the gear menu offers Small, Medium and Large. Larger cards are readable from further away, which matters when the screen is on a wall behind a hitting bay. Smaller cards keep more metrics in view at once. Pick the size by how far you usually stand from the screen, not by how the column looks when you are sitting at it.
The column in Compare mode
In Compare the same metrics appear as a horizontal strip rather than a vertical column, with both swings’ values on each card so the difference is the thing you read. The metrics are the ones you already chose, so moving into Compare does not mean setting them up again. If the second swing lacks a metric the first one has, that side of the card dashes out on its own.
Show and hide is still per view mode, so you can have the strip in Compare and no column in Single Recording, or the reverse.
Current limits
Two things are missing from this release.
Left foot and right foot separately. Force and torque metrics are reported for the two feet combined. You cannot choose a single foot. Pressure distribution metrics are unaffected, because they are already reported per side.
The question mark in Compare mode. The explanation flyout is on the cards in the vertical column. The horizontal strip in Compare mode does not carry it yet, so to read a metric’s description, open it from the column in a single-swing view mode.
Quick reference
| You want to | Go to |
|---|---|
| Show or hide the column | The Layout menu, checkbox under the view-mode list. Set per view mode. |
| Add one metric | Add metric… at the bottom of the column |
| Remove or change one metric | Click the card and use its menu |
| Reorder the cards | Drag a card in the column, or use Choose metrics… |
| Rebuild the column | Gear menu, Choose metrics… |
| Load a different group of metrics | Gear menu, Metric sets, or the metric sets button in the column header |
| Save your own group | Metric sets, then Save current as… |
| Switch between measured units and body weight | Gear menu, Value |
| Make the numbers bigger | Gear menu, Card size |
| Find out what a metric means | The question mark in the card’s top right corner |