Using the graph library
Introduction
This article aims to demonstrate the new features included in the new graph library present in Swing Catalyst (versions 9.7 and newer)
Features include:
Zoom and panning of the graph using the mouse / keyboard.
Support for showing individual data per plate in Dual Motion Plate / Dual Force Plate setups.
Greatly improved rendering performance.
In detail:
CTRL + mouse scroll will zoom in / out where the mouse pointer is located on the graph.
CTRL SHIFT + mouse scroll to pan.
Double click to reset zoom level.
Click and drag to zoom.
Lets take a look at the functionality!
Zoom functionality
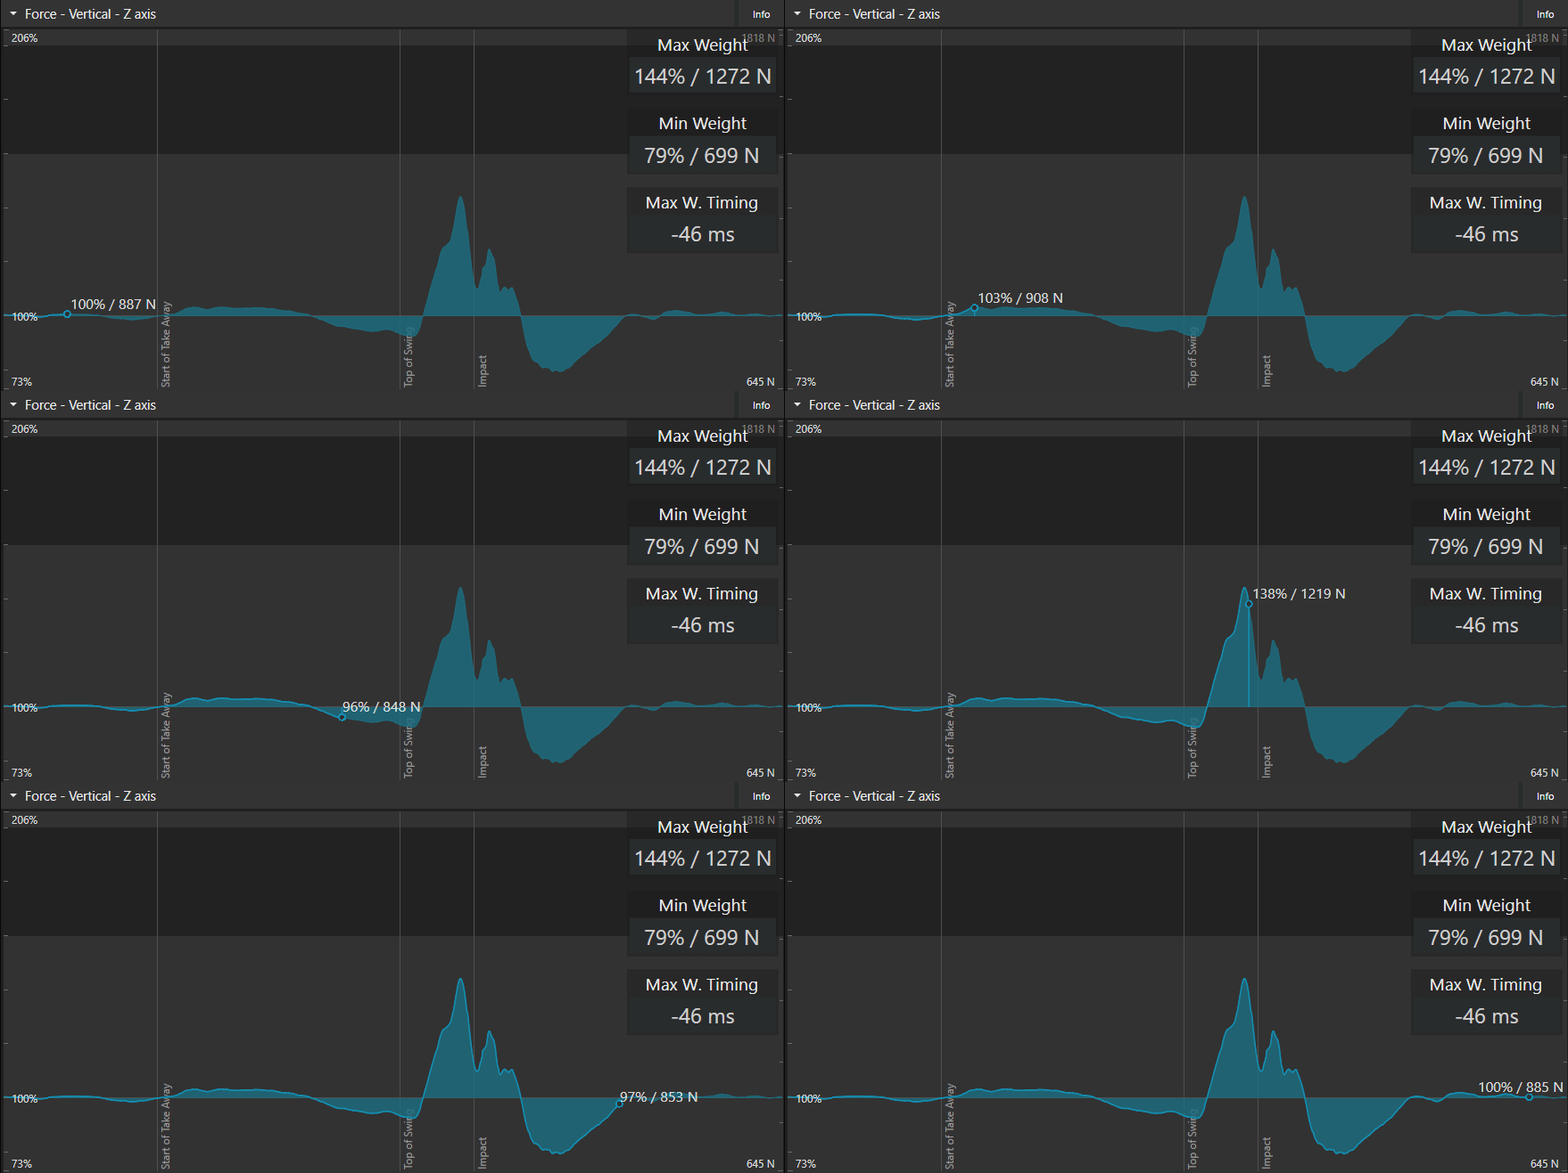
Click and Drag
- Click and drag to select a section you wish to look more closely at.
Tip: Double click the mouse to reset the zoom level.
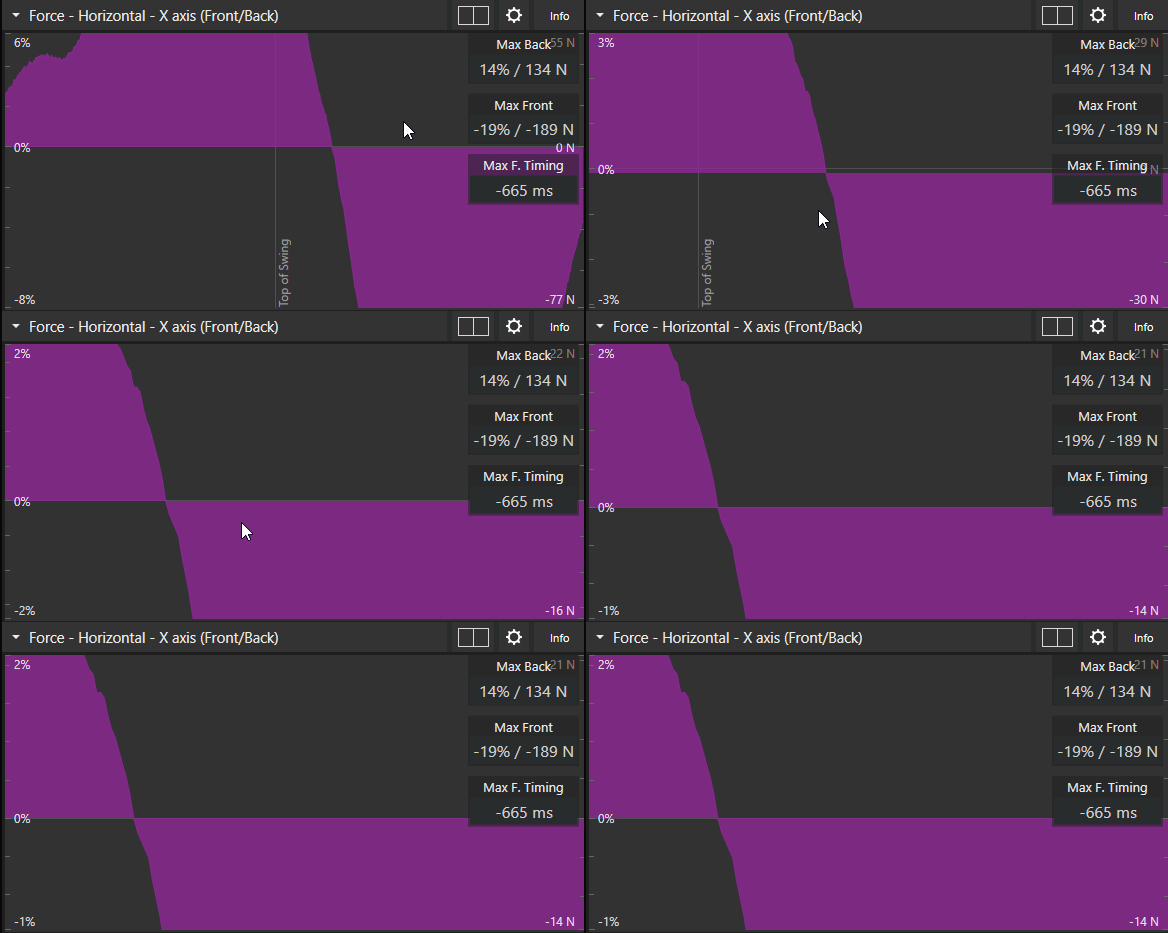
Ctrl Scroll zoom
Hold CTRL while scrolling the mouse to zoom in / out on the data.
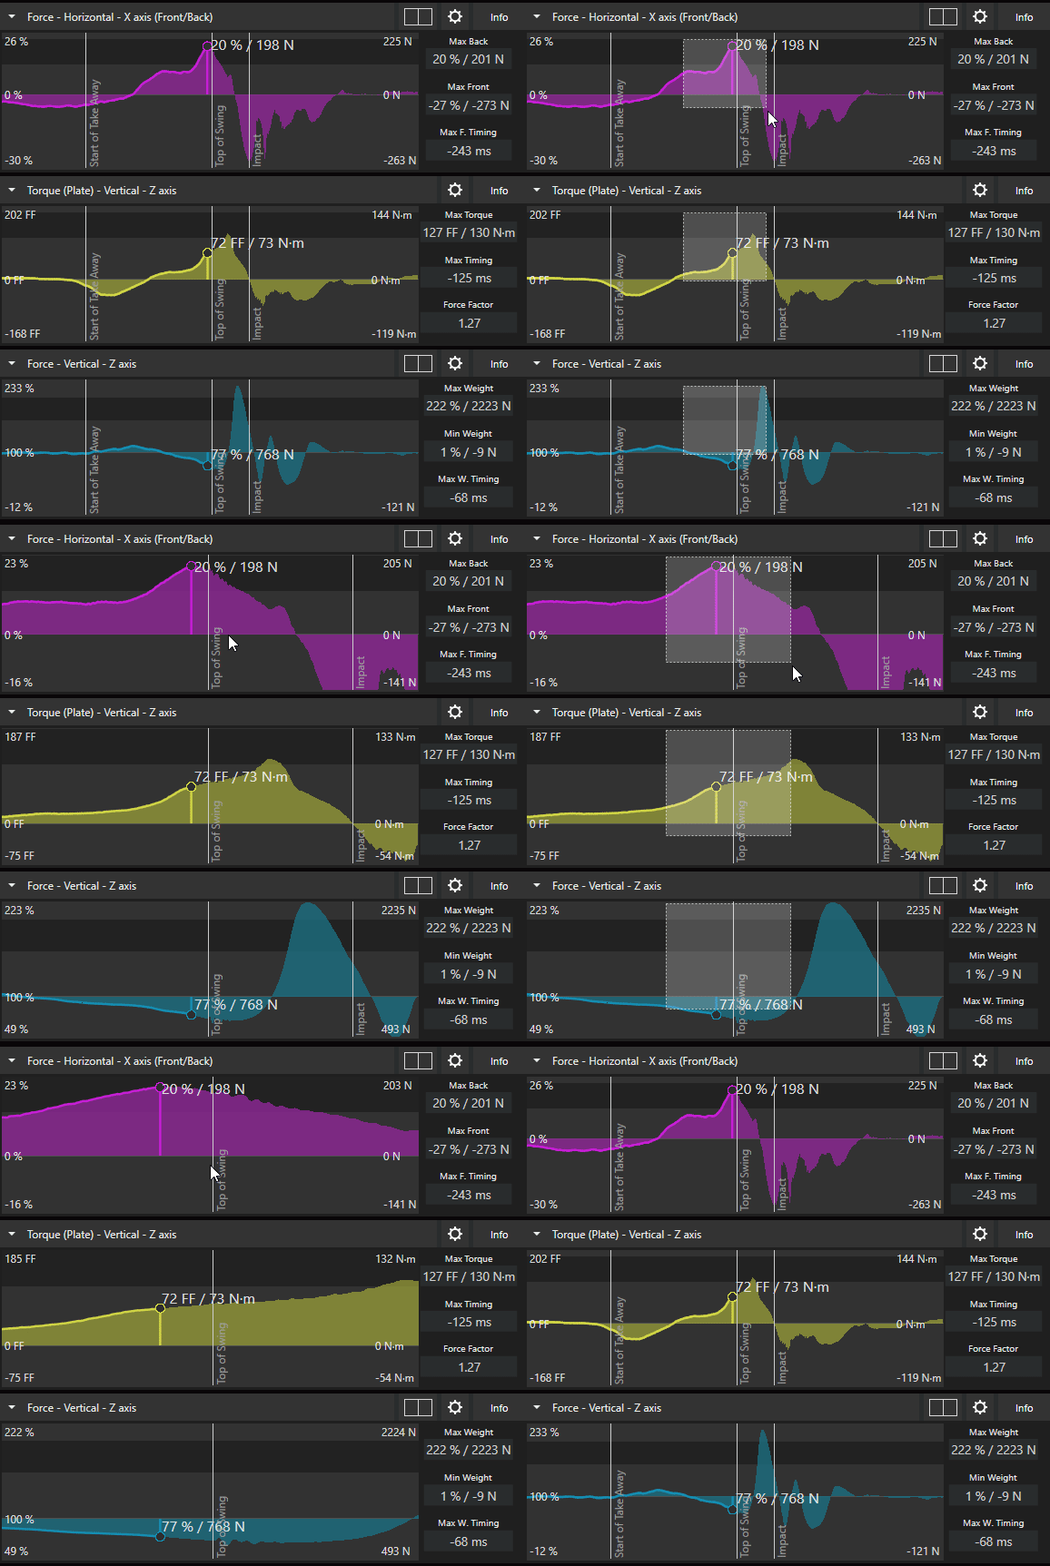
Hold Shift while scrolling the mouse to zoom about the X-axis.
Tip: To reset, double click the mouse.
Zooming about the X-axis (Shift Scroll):
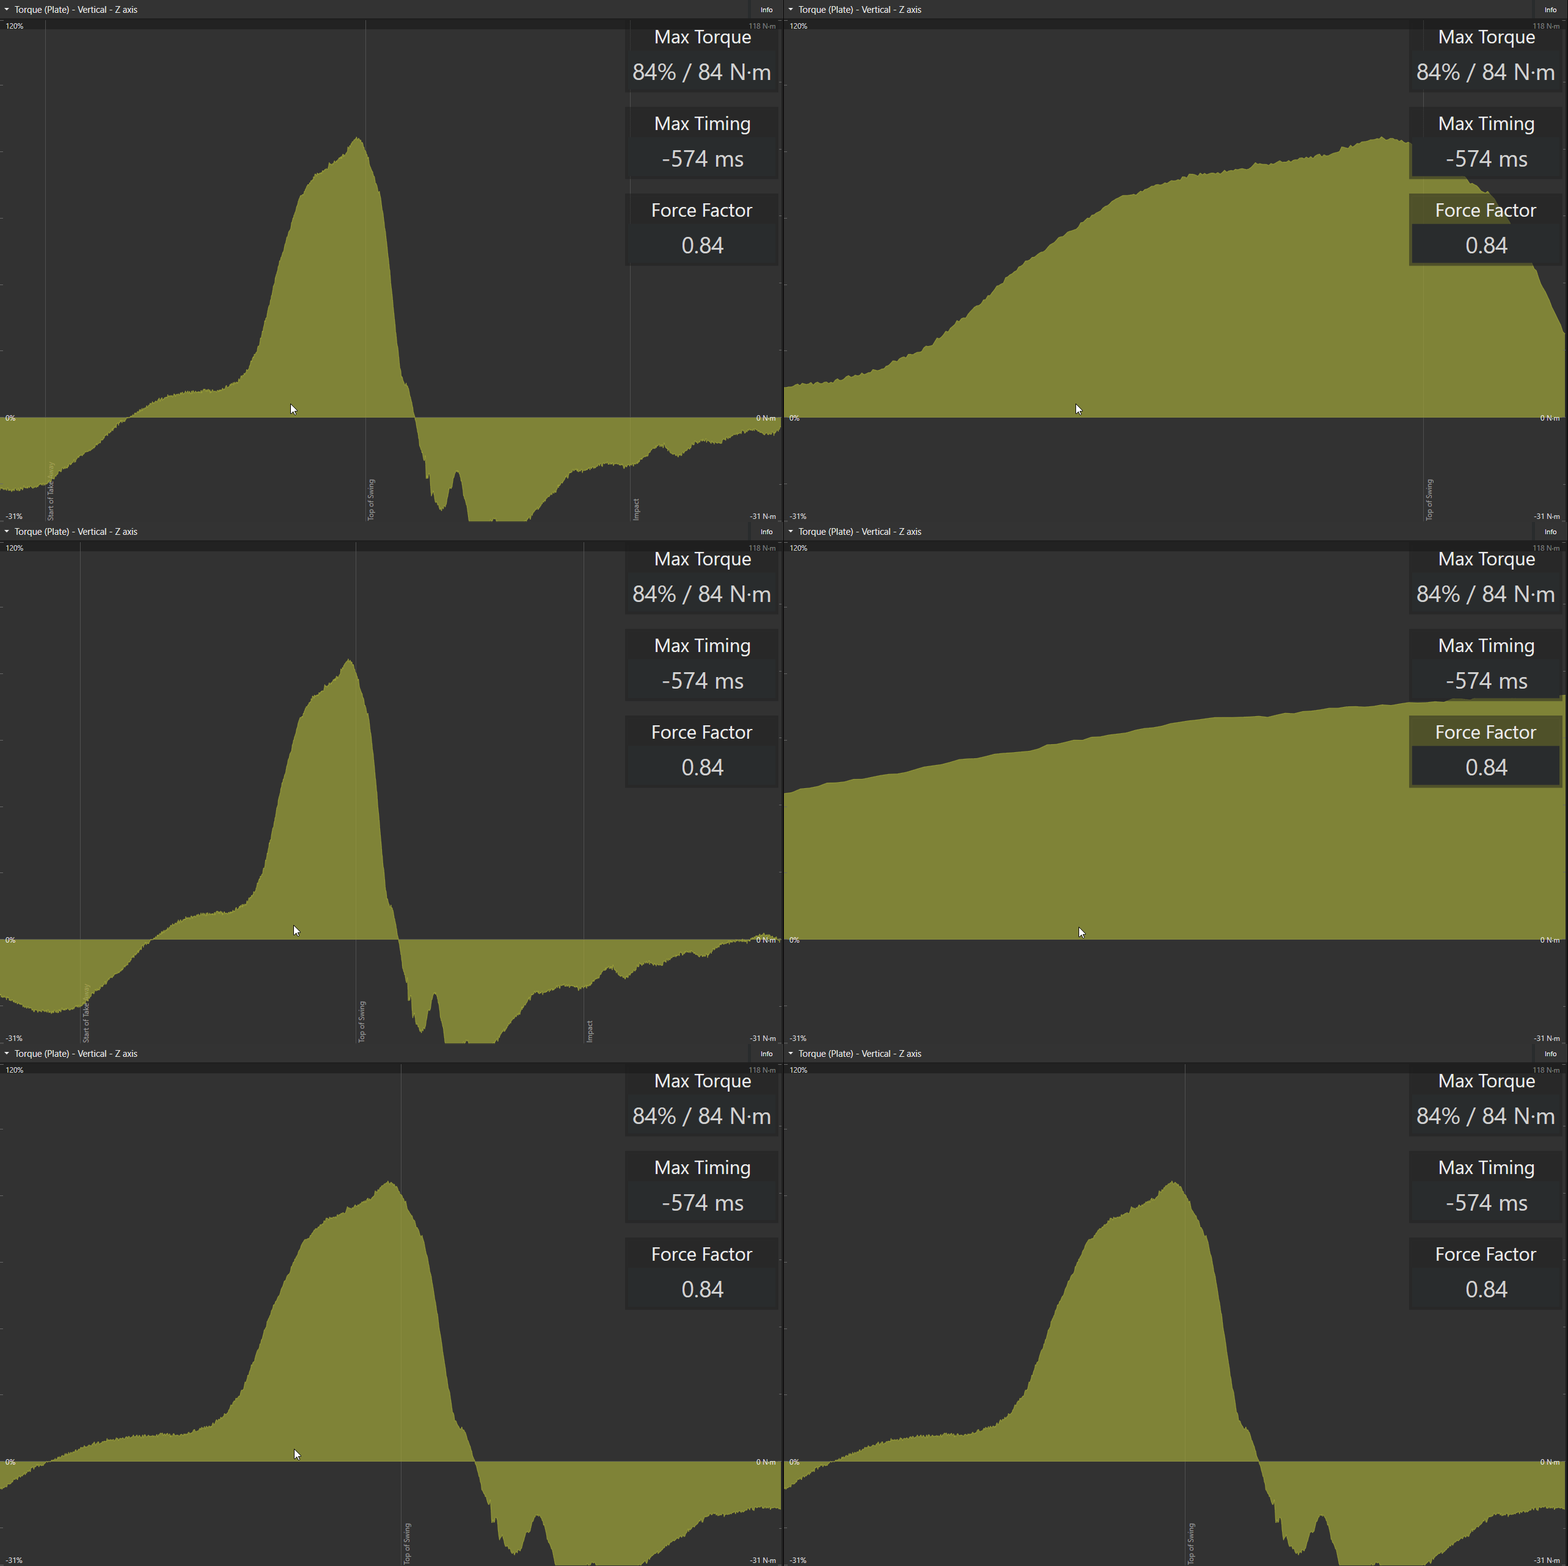
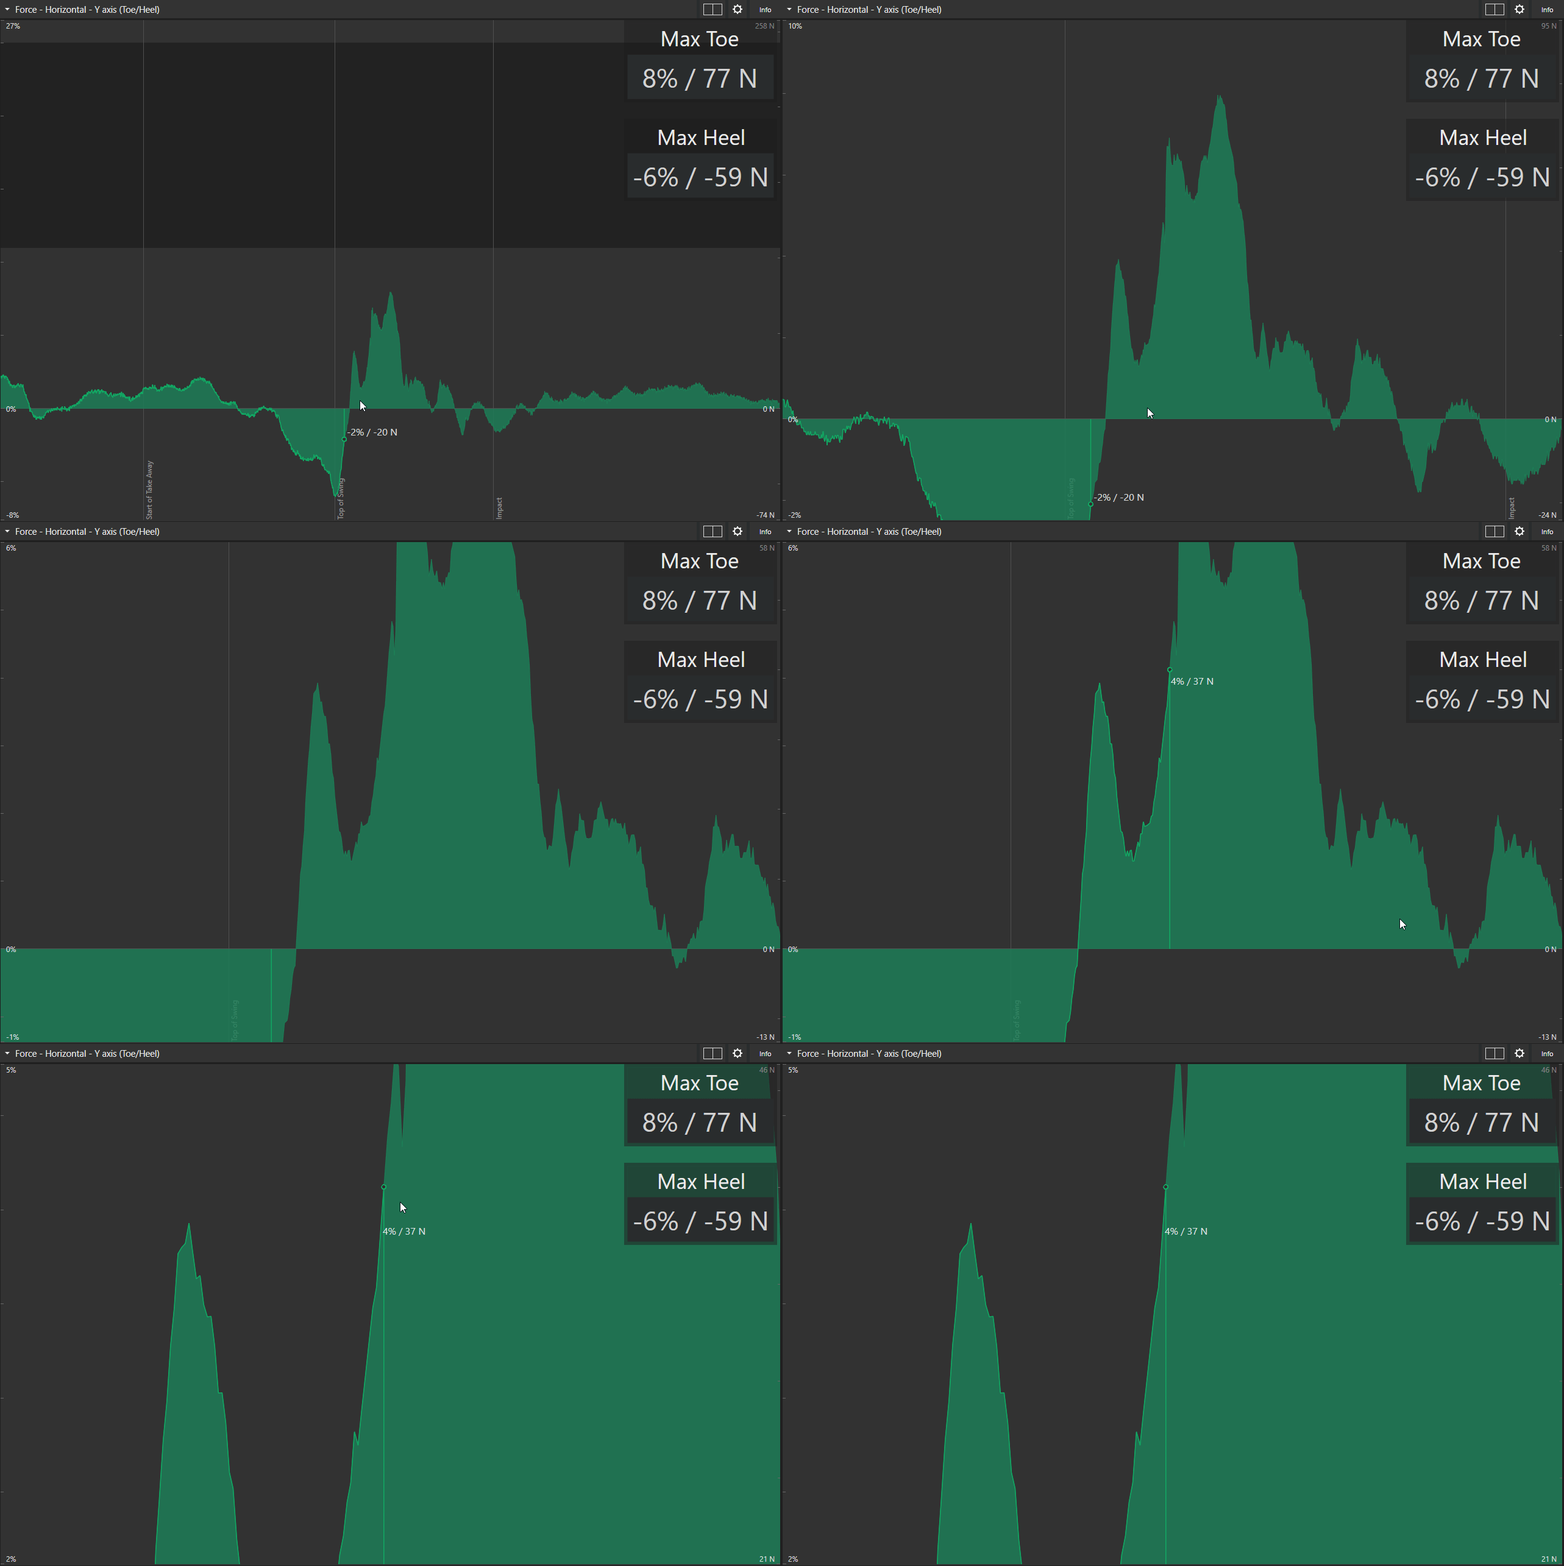
Panning
- Ctrl Shift Scroll to pan
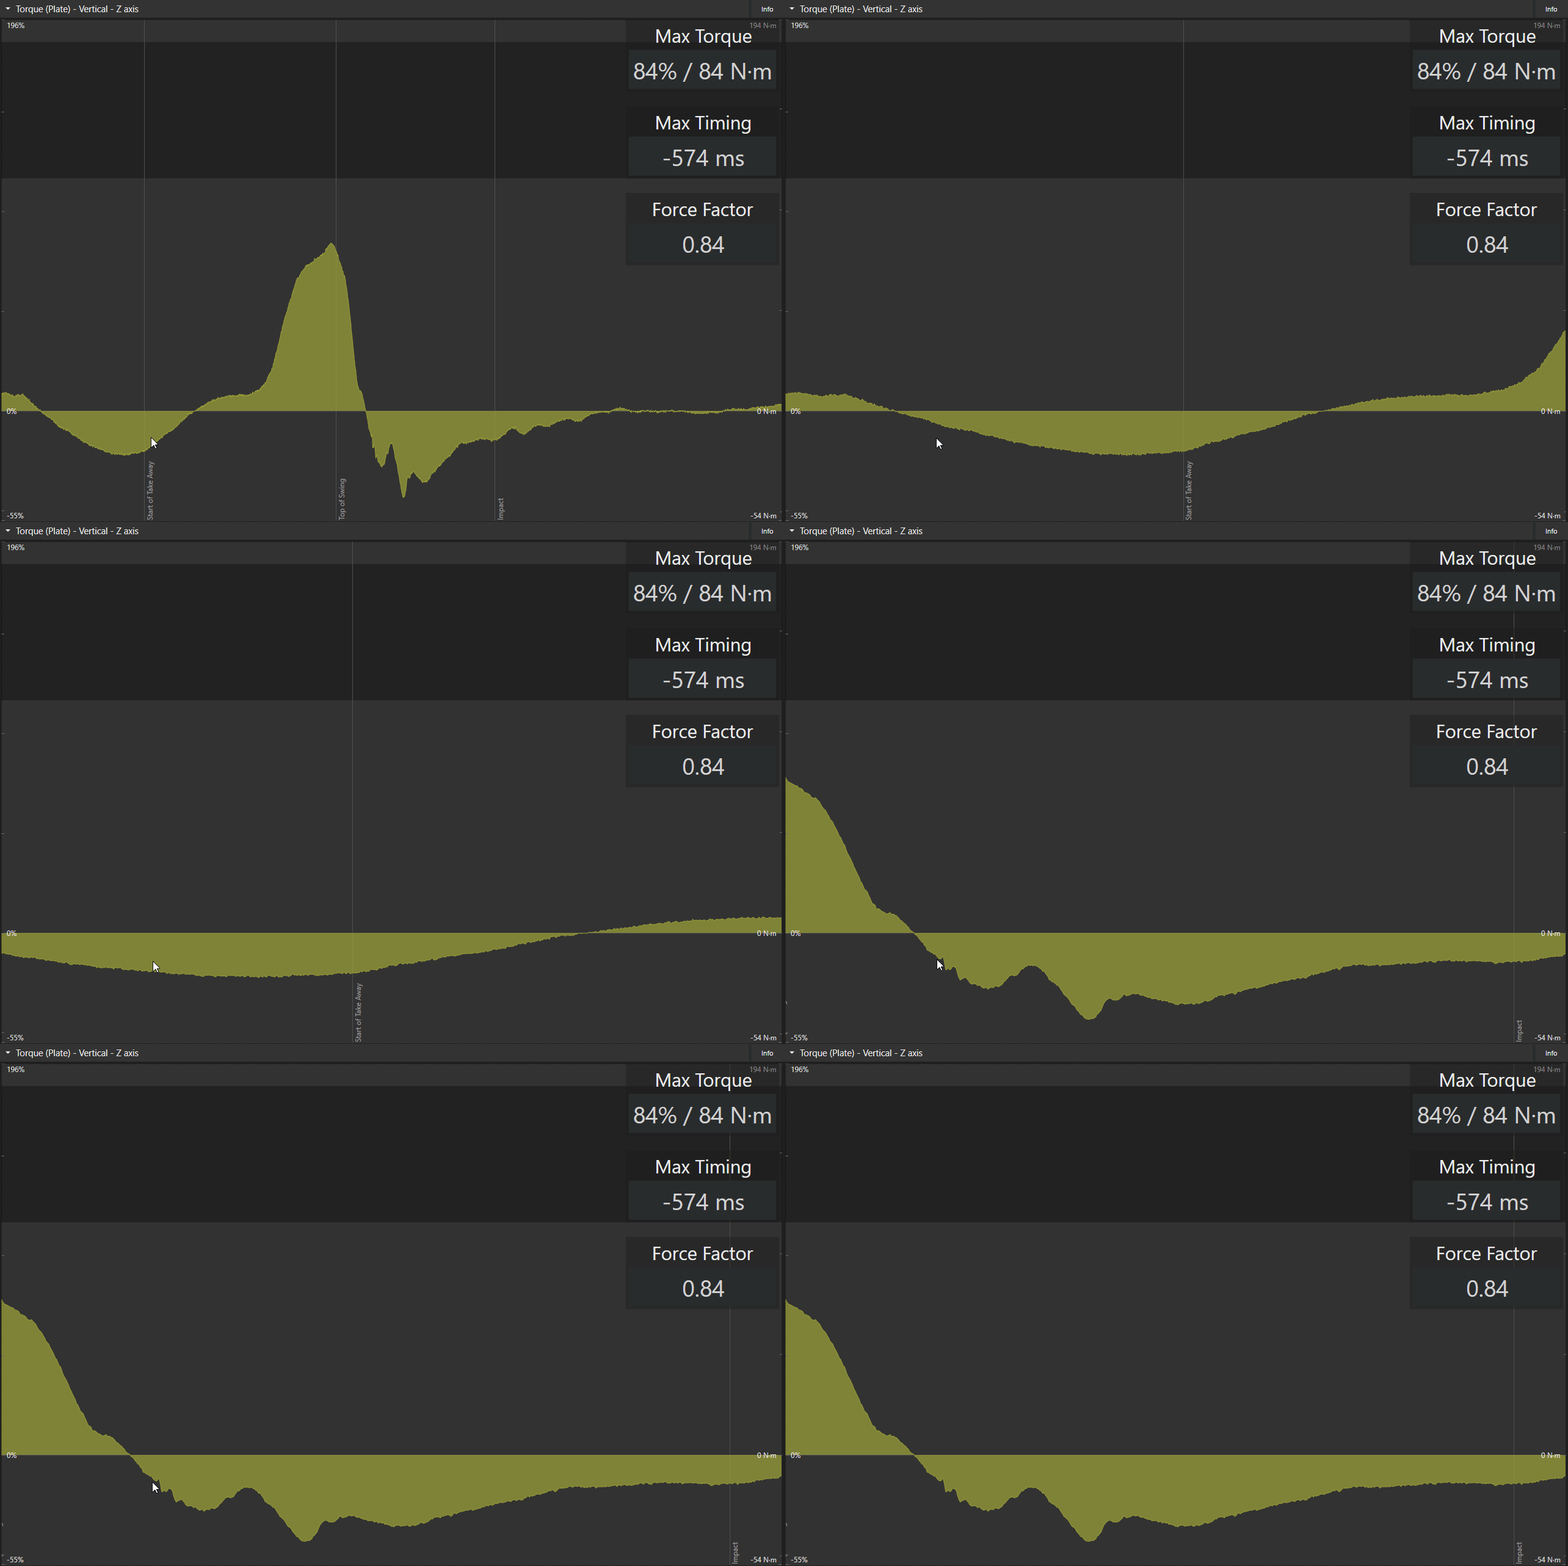
Viewing individual plate data
- Note: This is Dual Motion Plate / Dual Force plate specific functionality
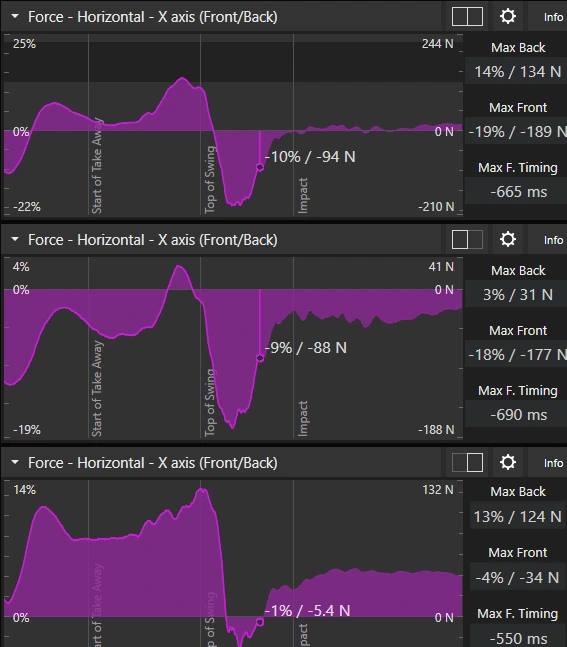
With dual force plates it’s possible to view data from each plate individually by clicking the plate indicator button to the left of the gear icon. The highlighted plate indicates which plate is being displayed.
In this example we’re viewing combined data (topmost graph), but also data from each plate individually (left & right foot):
Graph viewing options
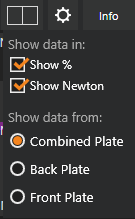
Clicking the gear icon gives you options on how to view the data. For example to show data in percentage or Newtons (or pound-force, lbf, if Imperial is selected in General Settings). Torque graphs use N·m (or lbf·ft).
Improved performance
The new graph library can utilize graphics cards for hardware acceleration, this means a significantly more responsive user experience without any significant costs (in terms of CPU and memory usage).